Global Economic Indicators ETL
This live system combines a World Bank ETL pipeline, a cleaned analytics dataset, an exploratory notebook, and an interactive dashboard into one data product.
The pipeline extracts raw indicator data, transforms it into both long and wide CSV outputs, and feeds a dashboard designed for KPI monitoring, trend analysis, and lightweight clustering-based insight generation.
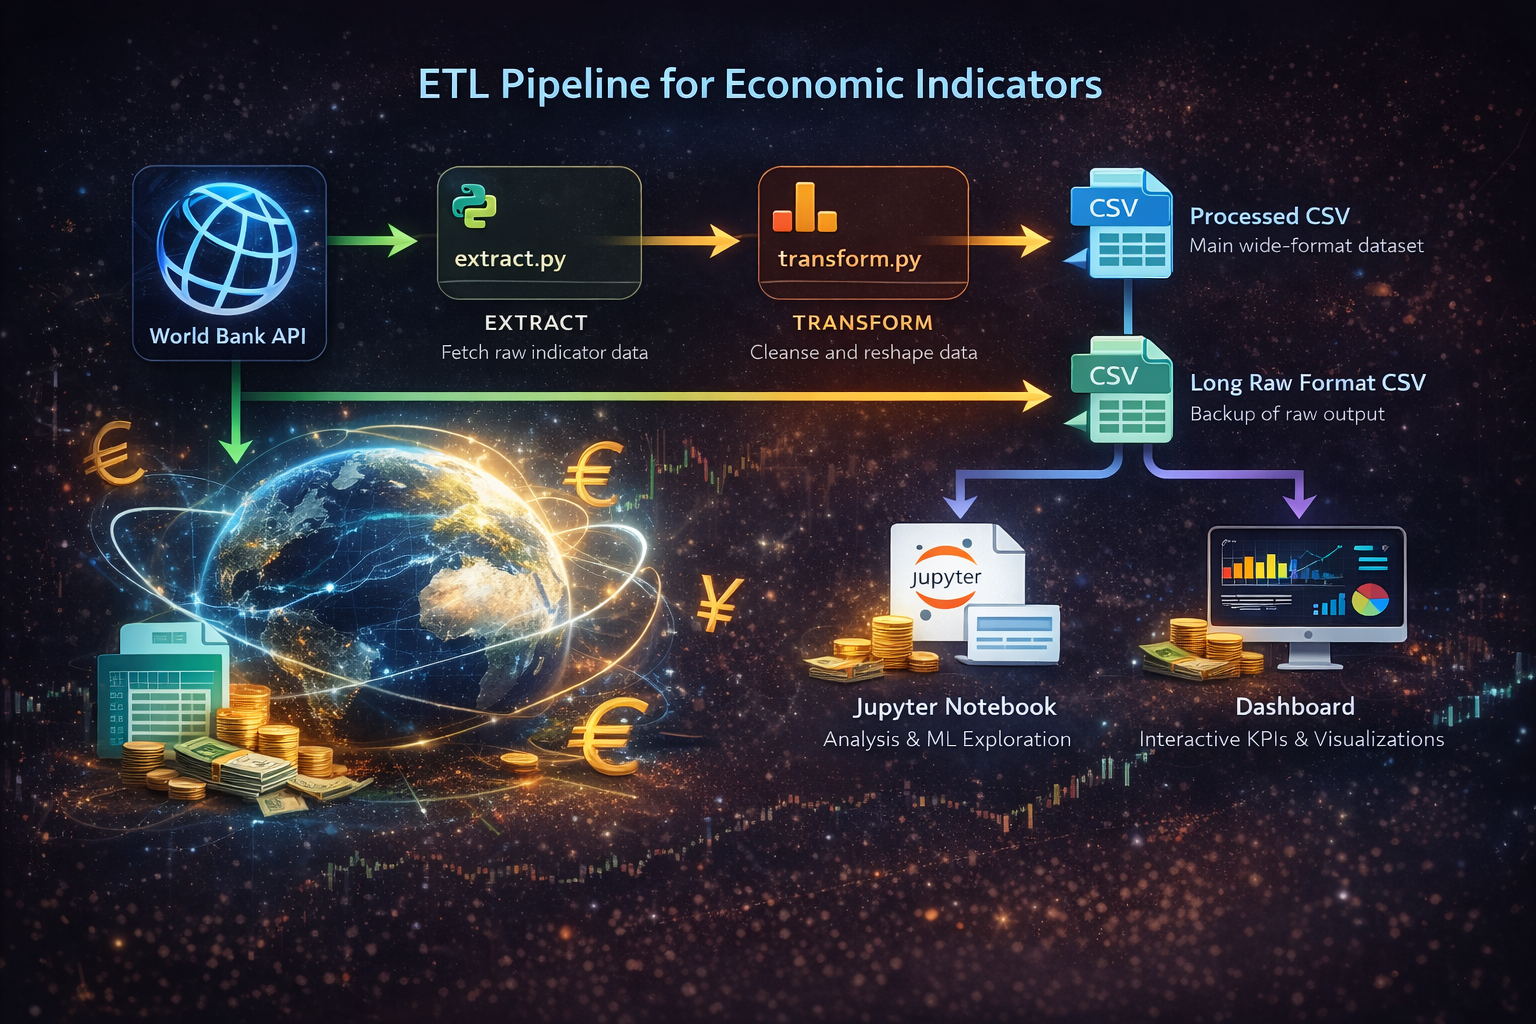
The system starts with the World Bank API, moves through Python extraction and transformation modules, saves raw and processed CSV outputs, and then powers both the analysis notebook and the dashboard interface from the processed dataset.
The diagram above is a visual map of the system flow: public macroeconomic data enters through the World Bank API, moves through the Python ETL pipeline for cleaning and reshaping, is saved into reusable raw and processed datasets, and then branches into two analysis surfaces, a notebook for exploration and an interactive dashboard for live presentation. It is meant to show how the project behaves as one connected data product: source acquisition, transformation, storage, and presentation are all linked in a single system instead of living as disconnected notebooks or scripts.


