Customer Segmentation & ML Evaluation
This project studies an imagined retail customer base to understand spending behavior, segment likely customer groups, and test how far simple machine learning models can go when asked to predict customer spending score from a small feature set.
The notebook combines exploratory analysis with four distinct ML views: linear regression for prediction, K-means for segmentation, a shallow decision tree for rule discovery, and Gaussian Naive Bayes for boundary-style classification. The strongest finding is that customer spending score is not strongly predictable using age and income alone, even though income still creates visible segments across the customer base.
Technologies Used
Project Focus
The analysis is built around a customer dataset with demographic, economic, and household signals including gender, age, annual income, profession, work experience, family size, and a spending score target. The main question is whether a compact feature subset can explain or predict customer spending behavior well enough to support business decisions.
The analysis moves across descriptive EDA, predictive modeling, and segmentation so that the same dataset can be tested from multiple angles. Instead of forcing one model to carry the entire interpretation, each method contributes a different view of customer behavior.
Dataset Snapshot
The notebook works from a 2,000-row customer file and immediately profiles the core numerical fields before modeling. That front-loads the project with baseline business context instead of treating machine learning as a black box.
Built from Age and Annual Income to estimate customer spending score.
Clusters customers using Age, Annual Income, and Family Size.
Age and income alone were not strong enough to explain or predict spending behavior.
Project Highlights
Baseline Prediction
Linear regression gives the project a supervised learning baseline and a measurable way to test whether age and income alone can explain spending behavior. The model shows they do not.
Customer Segmentation
K-means clustering adds a more business-ready layer by grouping customers into segments that are driven mostly by income differences rather than clearly distinct spending behavior.
Interpretable ML
The depth-limited decision tree turns the notebook into an explainable ML exercise by showing concrete age and income splits, while also revealing that those features have limited predictive force.
Honest Evaluation
The weak regression metrics stay visible because they are the central analytical result, not a side note: the model largely defaults toward the mean spending score.
Model Performance Readout
The regression model is the cleanest place to judge predictive strength because it is the only section with explicit holdout evaluation metrics. Those results are useful precisely because they show the limits of the feature set: the model produces a measurable baseline, but not a strong one.
| Metric | Value |
|---|---|
| Mean Absolute Error | 23.56 |
| Root Mean Squared Error | 27.77 |
| R-Squared | -0.005 |
| MSLE | 0.676 |
Interpretation
Regression weak
The linear model behaves more like a baseline than a final answer. It predicts spending scores for new customers, but its fit quality is too weak to support meaningful customer-level prediction.
Clustering useful
K-means separates customers more clearly by income bands than by spending behavior, which suggests the current features are better for broad grouping than for behavioral segmentation.
Tree logic interpretable
The shallow decision tree adds explainability, but the splits do not materially improve the ability to predict spending score. That points to weak feature importance rather than strong decision boundaries.
Model Visuals
The notebook produced several plots that are worth surfacing directly here. These are the clearest visuals for understanding why the project is stronger as an ML case study than as a simple prediction demo.
Actual vs Predicted Spending Score
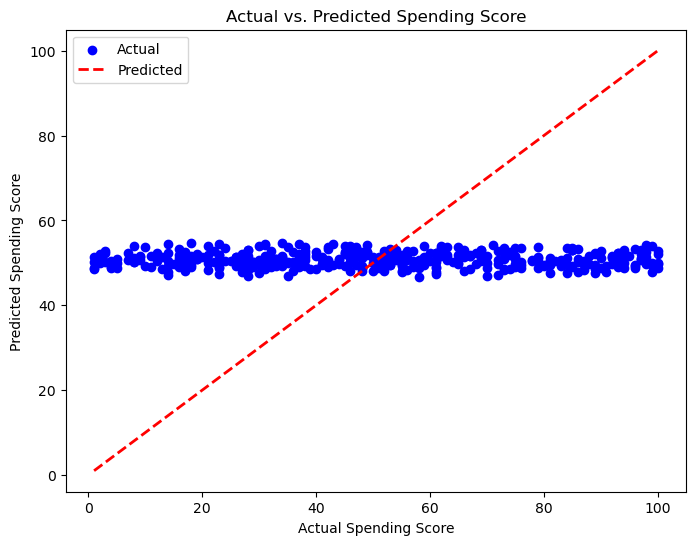
This scatter plot is the cleanest visual explanation for the regression result. If the model were fitting strongly, more points would concentrate tightly around the diagonal reference line. Instead, the spread reinforces the weak R-squared and shows that a simple linear relationship is not capturing customer spending behavior very well. The model is effectively falling back toward the average.
K-Means Customer Clusters
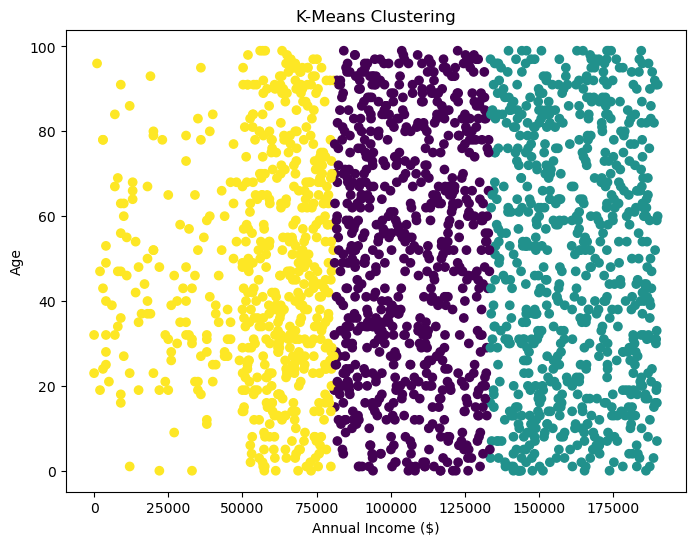
Clustering reveals separable customer regions across age and income, but the groups are still more reflective of income structure than clear differences in spending behavior. That limits how actionable the segmentation is without richer features.
Decision Tree Logic
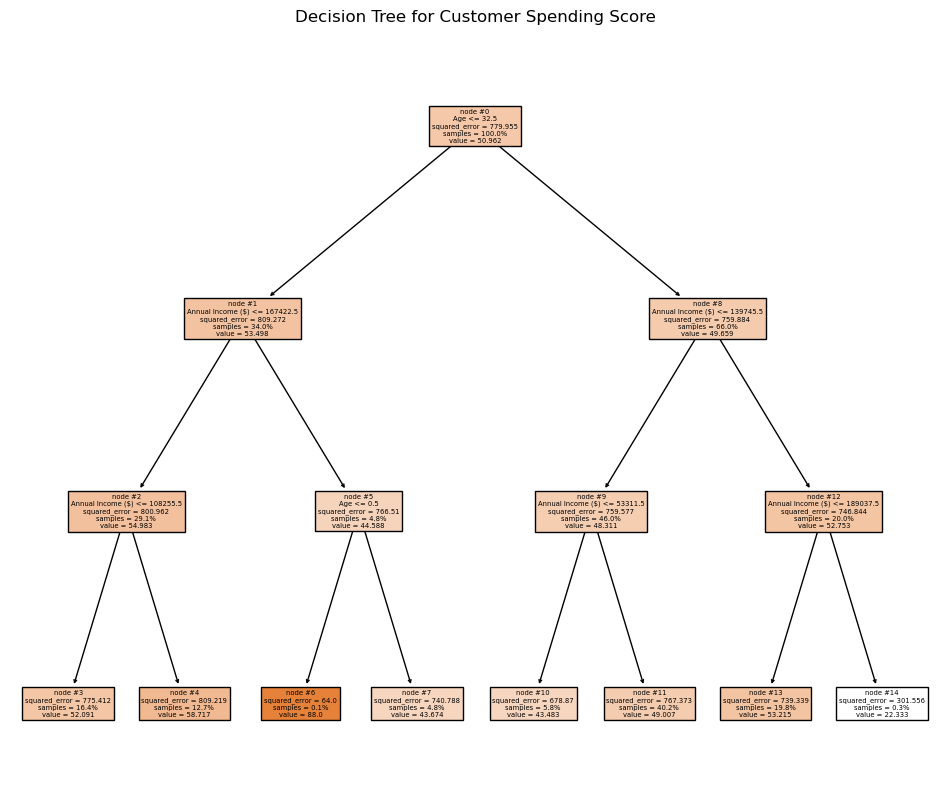
The decision tree gives the analysis interpretability. Instead of one flat line, the model introduces conditional splits that show where combinations of age and income branch. The result is readable, but the branches still do not reveal strong predictive leverage.
Performance Metrics Snapshot
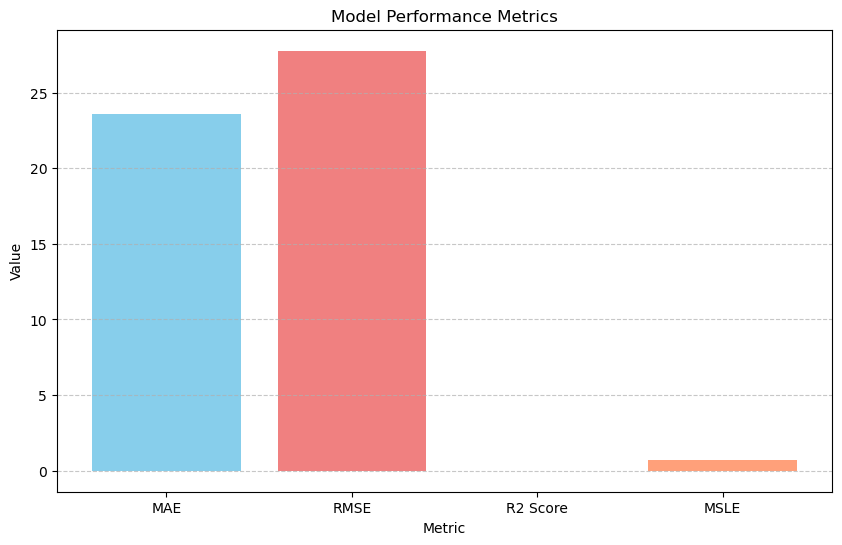
The metric bar chart supports the written readout by making the weak regression performance immediately legible. It works well on the page as a quick scoreboard beside the more interpretive visuals.
ML Components Used In The Notebook
Linear Regression
Used as the main supervised baseline with Age and Annual Income as features and Spending Score as the target. This section also includes holdout evaluation and predicted scores for new customer profiles.
The main result is that the model underfits. Instead of capturing strong variation, it trends toward the mean spending score and reinforces that the chosen features are not sufficient.
K-Means Clustering
The clustering section shifts the project from prediction to segmentation by grouping customers through Age, Annual Income, and Family Size.
The resulting groups are more reflective of income structure than distinct spending behavior, which shows that segmentation quality is constrained by feature selection.
Decision Tree Regressor
A depth-limited decision tree adds interpretability by showing explicit splits across Age and Annual Income. This gives the project rule-based structure that a straight regression line cannot capture.
The capped depth keeps the visualization readable and also makes it clear that the available splits do not produce a strong predictive structure.
Gaussian Naive Bayes
The Naive Bayes section creates a classification-style boundary view over the same feature space. It is less about final model selection and more about exploring how separable customer behavior looks under a probabilistic assumption.
Together, the four approaches show that segmentation and interpretability reveal more than direct prediction when the feature set is limited.
What The EDA Supports
The early charts profile gender balance, age distribution, annual income distribution, and correlation structure before modeling begins. That matters because the later model results only make sense in the context of the underlying customer distribution.
The pairplot and heatmap sections are especially helpful for showing why spending score does not behave like a simple linear outcome of age and income.
Business Reading
The regression result says the simplified demographic feature set is not enough on its own. The clustering and tree views show that customer groups and conditional patterns still contain some structure, but not enough to explain spending behavior reliably.
The practical implication is that demographic segmentation can describe broad customer bands, but it is too shallow to explain day-to-day spending behavior on its own.
Business Interpretation
The most important result in this project is that demographic variables can separate customers without explaining how they actually spend. Income creates visible bands, but those bands do not translate into strong spending prediction.
Income Creates Segments, Not Strong Spending Prediction
Income separates customers into clear groups, but it does not strongly explain how much they spend. That means segmentation by income alone is not enough for confident business decisions.
Regression Collapses Toward The Average
The regression model defaults toward the mean spending score, which is a strong signal that age and income do not have enough explanatory power on their own.
Behavior Matters More Than Demographics
Spending behavior appears to be shaped more by customer actions than by age or income alone. That is why the segmentation view is more informative here than the straight regression fit.
Demographic-Only Segmentation Has Limits
The project highlights an important business constraint: even when demographic groups are visible, they may not be behaviorally rich enough to support strong targeting or prediction.
Customer spending does not rise cleanly just because income rises. The clearest analytical value here is showing that demographic-only models can produce visible segments without producing strong behavioral prediction.
Key Insights
Customer Spending Score Is Not Strongly Predictable
Customer spending behavior could not be accurately predicted using demographic features like age and income alone, indicating that behavioral or transactional data is required for meaningful prediction.
Income Does Not Equal Spending Behavior
Although customer segments could be clearly grouped by income levels, spending score showed weak correlation with income, suggesting that higher income does not necessarily translate to higher spending.
Decision Tree Splits Show Weak Feature Importance
Decision tree analysis revealed that while age and income influenced segmentation, they had limited impact on predicting spending score, highlighting weak feature importance.
Regression Defaults Toward The Mean
The regression model defaulted to predicting the mean spending score across customers, indicating underfitting and lack of strong predictive signals in the dataset.
Segmentation Needs Behavioral Data
Customer segmentation using K-Means primarily reflected income-based groupings rather than meaningful behavioral segments, suggesting the need for richer features such as purchase frequency or transaction data.
Notebook Trace
The notebook follows a clean progression from exploratory analysis into multiple ML techniques. These are the main phases preserved in the original artifact.
EDA & Data Prep
The opening cells load the customer file, inspect summary statistics, and check missingness before moving into gender, age, income, and correlation visualizations.
Prediction Layer
The regression cells create a train-test split, fit a linear model, predict spending score, and score the output with MAE, RMSE, R-squared, and MSLE.
Segmentation Layer
K-means introduces unsupervised grouping and shifts the conversation from exact prediction to customer cohort discovery using a richer feature mix.
Interpretability Layer
The decision tree and Naive Bayes visualizations round out the project by showing boundary logic and interpretable splits across the customer feature space.
Project Highlights
Customer Analytics Dataset
Works from demographic and household-level customer fields including age, income, family size, profession, and spending score.
Regression Baseline
Uses linear regression to test whether age and annual income can predict spending score, then evaluates that fit with MAE, RMSE, R-squared, and MSLE.
Clustering & Tree Models
Combines K-Means, a depth-limited decision tree, and Gaussian Naive Bayes to compare segmentation, interpretability, and boundary-based behavior.
Underfitting Insight
Shows that the models rely too heavily on weak demographic signals, with regression falling back toward the mean and segmentation staying mostly income-driven.