Iris Classification & Model Comparison
This project uses the classic Iris dataset to compare multiple supervised and unsupervised learning approaches on a small, clean multiclass problem. The notebook combines exploratory analysis, decision boundaries, tree visualization, clustering, and a final supervised classification test.
The analysis shows that petal-based features are significantly more predictive than sepal features, enabling high classification accuracy across multiple machine learning models. In this notebook, petal-driven separation is especially strong, and the final SVM classifier reaches perfect accuracy on the held-out split.
Technologies Used
Project Focus
The notebook works from four flower measurements: sepal length, sepal width, petal length, and petal width, with three species labels. The analysis asks two straightforward but useful questions: how separable are the classes visually, and how differently do common ML models behave on the same feature space?
That makes the project a compact survey of model behavior rather than a single-model demo. It compares decision trees, KNN, Naive Bayes, Random Forest, SVM, Logistic Regression, and K-Means clustering on one shared dataset.
Dataset Snapshot
The starting dataset contains 150 rows and 5 columns, with no missing values and 3 duplicate rows identified in the quality check step. Species classes are evenly balanced, which makes the dataset especially useful for model comparison and visual interpretation.
Perfect accuracy on the held-out classification split in the notebook's final supervised test.
Each Iris species is equally represented, which reduces bias in the classifier comparison.
No null values were found across the four measurement columns or the target species label.
Clustering is used to test whether natural grouping appears even without species labels.
Supervised Performance Readout
The final supervised section uses an SVM classifier on the full four-feature dataset and reaches perfect held-out performance. Because Iris is clean and well-separated, the main value here is less about "beating" the dataset and more about showing how multiple model families behave on a problem with clear class structure.
| Metric | Value |
|---|---|
| Accuracy | 1.00 |
| Precision | 1.00 |
| Recall | 1.00 |
| F1 Score | 1.00 |
Interpretation
Clean separation
The dataset is small, balanced, and clean, which lets the class structure appear clearly in both the visualizations and the final model results.
Petal features matter
The pairplot and tree logic make it clear that petal measurements carry most of the class separation signal, especially for Setosa.
Good for comparison
This is a strong model-comparison dataset because the classes are separable enough to expose different boundary styles without being overwhelmed by missingness or imbalance.
Key Insights
Species Separation Is Visually Strong
Exploratory plots show that the Iris classes are not randomly mixed. Petal length and petal width create much stronger class separation than sepal measurements, which explains why several models perform well.
Petal Measurements Drive Most Of The Signal
Petal length and width show clear separation between species, while sepal measurements overlap significantly. The decision tree and pairplot both point to petal-based features as the primary drivers of classification.
Boundary Shape Changes By Model
KNN, Naive Bayes, Random Forest, SVM, and Logistic Regression all carve the same feature space differently. Simpler models work well because the data is clean and near-linearly separable, while more flexible models help mainly in overlapping regions.
K-Means Still Finds Useful Structure
Even without labels, clustering shows that the data has real internal grouping. The elbow view and clustering plot indicate three natural clusters that align closely with the true species labels.
EDA Reading
The notebook starts with data shape checks, null checks, duplicate review, summary statistics, and grouped descriptive statistics by species. That front-loads the analysis with enough data context to make the later modeling sections interpretable instead of opaque.
The histogram grid and pairplot are especially important because they show which features look bimodal or clustered before any classifier is trained.
Business Reading
This project is less about a deployment scenario and more about explaining model behavior on a clean classification problem. The strongest value comes from showing how different algorithms partition the same data and why some features matter more than others.
The results also reinforce two broader modeling lessons: feature selection matters more than model complexity when the signal is strong, and more complex methods help mainly where class overlap begins to appear.
Model Visuals
The notebook produced several clean model visuals that are worth surfacing directly here because they make the separation logic easy to understand at a glance.
Pairplot By Species
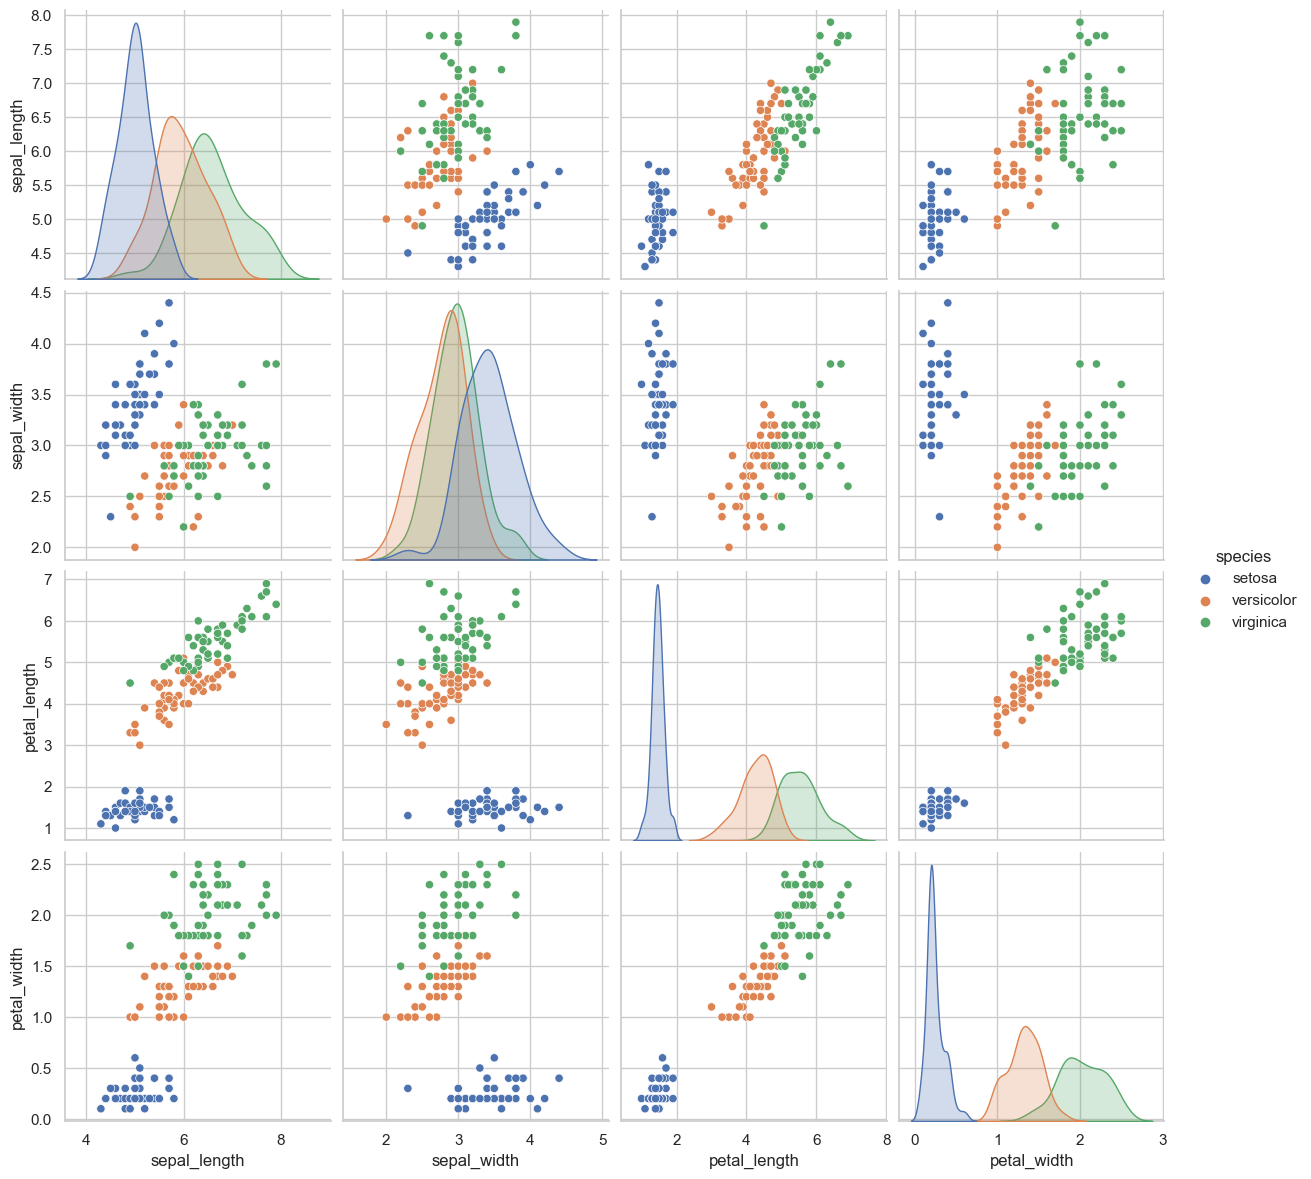
The pairplot is the strongest visual in the notebook. Setosa is clearly separable from the other species, while Versicolor and Virginica overlap enough to make them more challenging. It also makes the dominance of petal features obvious at a glance.
Decision Tree Structure
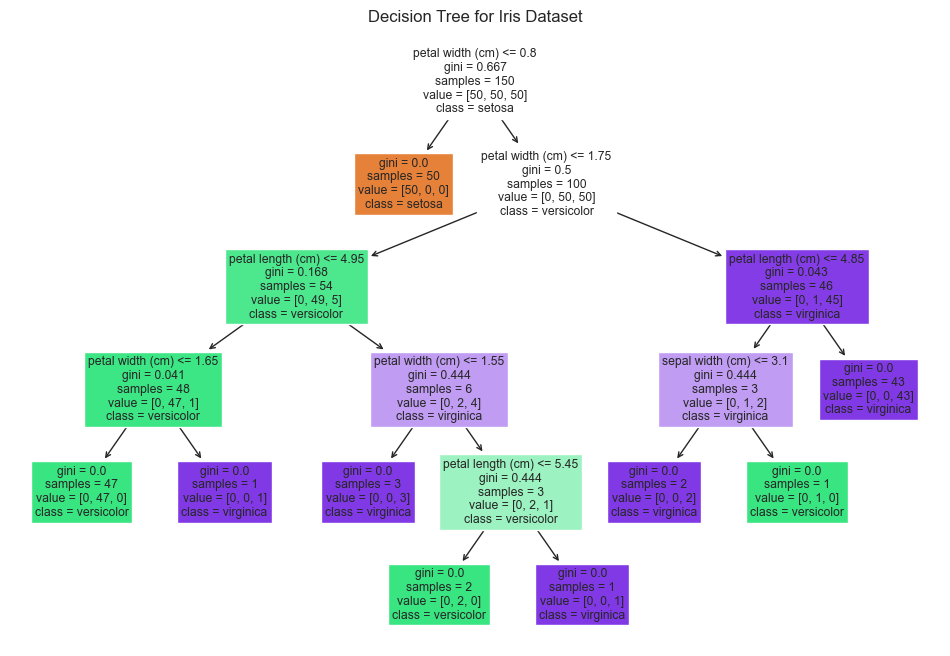
The tree visualization makes feature importance readable. Petal width appears at the root and drives most of the branching structure, which marks it as the most important classification feature in the model.
KNN Decision Boundaries
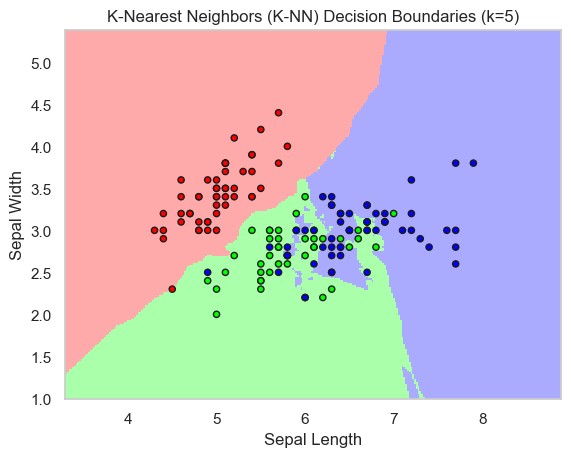
This plot shows how a local-neighborhood model partitions the two-feature space. The flexible boundaries adapt well to the data shape, but the overlap zones remain the most sensitive areas.
K-Means Elbow Curve
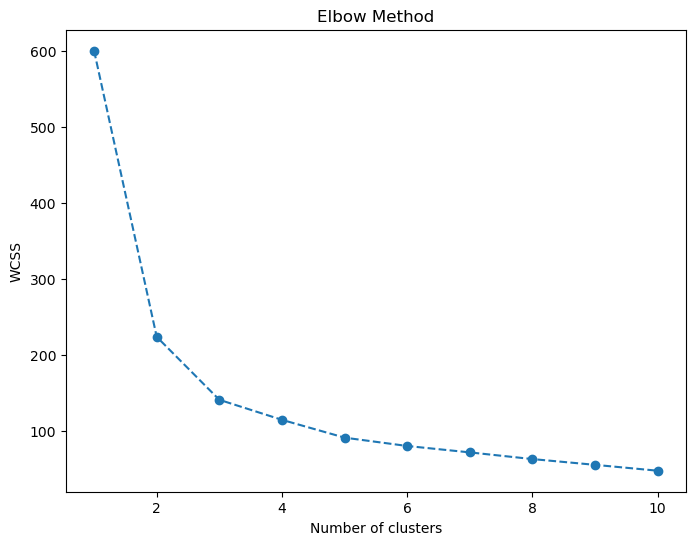
The elbow curve provides the unsupervised side of the story. It supports a three-cluster reading, which aligns closely with the true species structure and confirms that the dataset contains strong inherent grouping even without labels.
The clearest conclusion from the full notebook is that feature quality drives the result more than model complexity. Petal measurements carry most of the separability, simple models perform well because the data is clean and structured, and more complex methods mainly add value in the regions where Versicolor and Virginica begin to overlap.
The petal measurements did most of the heavy lifting because they clearly separate the different flower types. Since the data is already clean and well-structured, even simple models worked really well.
The only time more complex models actually helped was in those edge cases where two flower types start to look similar. That is where the classification problem gets a bit messier.
Model Selection Takeaways
Feature Quality Matters Most
Petal length and width do most of the classification work. Once those features are present, the problem becomes much easier to solve across multiple model types.
Simple Models Already Perform Very Well
SVM and Logistic Regression perform strongly because the dataset is already clean and close to linearly separable in the most important dimensions.
Complex Models Help In Overlap Regions
KNN and Random Forest become most useful in the parts of the feature space where Versicolor and Virginica start to resemble each other more closely.
The Dataset Has Strong Natural Structure
K-Means finds three natural clusters that align closely with the species labels, which is why both supervised and unsupervised views look so clean in this project.
Notebook Trace
Data Checks
The notebook begins with shape, null, duplicate, and summary-statistic checks before moving into grouped species summaries.
Exploratory Visualization
Histograms and a pairplot establish the class structure visually before any modeling begins.
Model Boundary Survey
Decision trees, KNN, Naive Bayes, Random Forest, SVM, and Logistic Regression are all used to compare how different models slice the same data.
Supervised vs Unsupervised
K-Means adds an unsupervised view, while the final SVM classification closes with a clean held-out evaluation and classification report.
Project Highlights
Clean Classification Dataset
Uses a balanced three-class flower dataset with no missing values and only a small number of duplicate rows identified in the quality check.
Visual Model Comparison
Compares how multiple classifiers create different decision boundaries across the same feature space instead of relying on a single model view.
Supervised & Unsupervised Learning
Combines classification models with K-Means clustering so the page shows both labeled and unlabeled structure in the Iris measurements.
Feature Interpretation
Highlights how petal-based measurements drive the strongest class separation and why that makes the dataset especially effective for teaching model behavior.