Facebook Friends Regression Analysis
This project examines a social-profile dataset to understand which profile, activity, and personal attributes are associated with Facebook friend count. The notebook combines a correlation heatmap with both single-variable and multivariate linear regression.
The strongest story in the data is not just friend count itself, but how engagement behaviors cluster together. Posting is tightly linked to replies, while photo activity is closely tied to albums and tags. Age also appears to reflect a life-stage shift in platform behavior, with older users showing smaller friend networks and slightly lower visual activity.
Technologies Used
Project Focus
The analysis uses Facebook-related profile and activity variables including age, photos, tags, albums, posts, replies, children, likes, education, events, and total friends. The goal is to measure how these variables relate to network size and which signals remain meaningful once they are combined in a multivariate model.
This makes the project less about prediction accuracy and more about relationship discovery: which variables appear directionally linked to friend count, and how much explanatory power do they actually provide?
Dataset Snapshot
The notebook runs on 715 observations and a set of profile/activity features. It begins with a correlation heatmap across non-binary numerical variables, then moves into repeated OLS models for single-variable and multivariate regression.
Age alone explains only a small share of variation in friend count despite being statistically significant.
The combined model improves explanatory power, but still leaves most variation unexplained.
These variables remain positive and statistically meaningful in the combined regression.
Older profiles are associated with lower friend counts in both the simple and multivariate models.
Regression Readout
The notebook runs OLS regressions with friend count as the dependent variable. The simple Age model is statistically significant but weak in explanatory power. The full multivariate model improves fit meaningfully, yet still explains only about 14.5% of the variance.
| Model | R-Squared |
|---|---|
| Age Only | 0.039 |
| Multivariate OLS | 0.145 |
Interpretation
No single dominant factor
Friend count does not behave like a one-variable outcome, so single-feature readings only tell part of the story.
Combined model is better
The multivariate regression adds useful signal, but the fit still remains moderate rather than strong.
Activity matters
Photos and tags appear to function as social-visibility variables, which helps explain why they stay meaningful in the combined model.
Key Insights
Content Creation And Interaction Move Together
The clearest relationship in the dataset is between posts and replies. Users who post more also tend to receive more replies, which makes posting behavior one of the strongest signals of network interaction.
Visual Activity Behaves Like A Distinct Engagement Style
Photos, albums, and tags rise together strongly enough to suggest a second engagement style: some users are not just posting content, they are organizing and labeling it in a more deliberate way.
Age Reflects Life-Stage Differences
Age is strongly related to number of children and shows a weaker negative relationship with friend count and photos. That suggests older users may use the platform in a more selective, less visually expansive way than younger users.
Friend Count Still Needs A Combined Reading
The regressions still matter because they show that friend count is influenced by several smaller effects at once. No single variable dominates, but age, photos, and tags all carry meaningful directional information in the combined model.
Analytical Reading
This project is strongest as a regression interpretation exercise rather than a prediction showcase. The heatmap and the OLS summaries work together to show which variables are mildly associated with friend count and which ones add independent signal once other factors are held constant.
The move from single-variable to multivariate regression is the key structural step in the notebook because it shifts the analysis from simple correlation-style reading to combined explanatory modeling.
Practical Reading
The project suggests that platform behavior clusters into two main patterns. Some users are highly conversational, posting more and generating more replies, while others lean into visual content through photos, albums, and tags.
Age appears to shape those patterns as well. Older users are more likely to have children, while younger users seem to maintain broader networks and slightly higher visual activity. Taken together, the data reads more like a platform-behavior study than a narrow friend-count prediction exercise.
Model Visuals
Correlation Heatmap
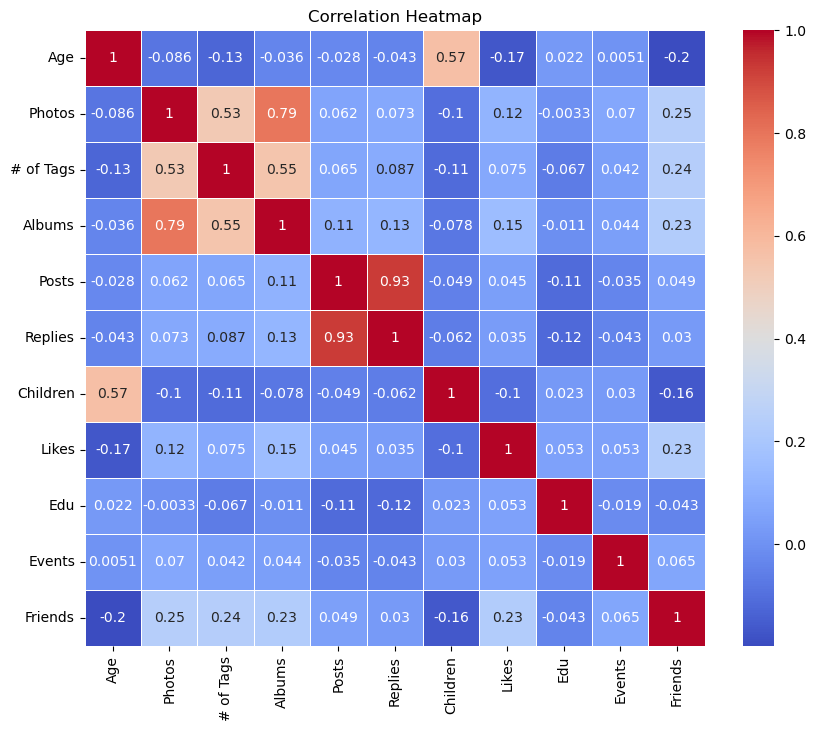
The heatmap is the main visual anchor of the notebook. It reveals two especially clear patterns: posts and replies move together almost perfectly, while photo activity is strongly tied to albums and tags. It also shows a life-stage signal where age rises with children but moves slightly downward with friend count and photo activity.
Regression Interpretation
The notebook's main model output is textual rather than graphical, so the real analytical value comes from the OLS summaries. Age, Photos, and # of Tags stand out as the most useful signals in the combined model, while the relatively low R-squared reminds us that social network size is shaped by multiple overlapping behaviors rather than one dominant variable.
The point of the regression here is to show which engagement and demographic variables retain directional signal once the model considers them together.
The clearest conclusion from the notebook is that engagement is not random. People who post more tend to generate more replies, and users who are more active with photos also tend to organize and tag that content more. Age adds a second layer by reflecting a life-stage shift in how the platform is used.
The heatmap reveals two clear patterns. First, user engagement behaviors cluster together: posting is strongly associated with replies, while photo activity is closely tied to albums and tags.
Second, demographic factors like age appear to shape platform behavior, with older users tending to have more children but slightly smaller friend networks and lower visual activity. Overall, the data suggests that both engagement style and life stage influence how users interact on the platform.
Strongest Heatmap Relationships
Posts And Replies Rise Together
Posts and replies move together almost perfectly, which makes posting behavior one of the clearest signals of interaction and conversational engagement in the dataset.
Photos, Albums, And Tags Form A Visual-Content Cluster
Photos are strongly tied to albums and moderately tied to tags, while albums and tags also rise together. That points to a more deliberate, content-curation style of platform use.
Age Connects To Life Stage
Age is strongly related to number of children and slightly negatively related to friends and photos, which supports the idea that life stage shapes how users engage socially online.
Education And Events Are Not The Main Story
The heatmap is much more informative for understanding content behavior, interaction behavior, and life-stage differences than for making a strong case around education or event activity.
Notebook Trace
Numeric Subset Construction
The notebook begins by building a subset of non-binary numerical variables from the broader Facebook friend dataset.
Correlation Review
A full heatmap is generated to inspect the relationship structure before any regression model is fit.
Single-Variable OLS
Each numerical variable is tested independently against friend count to see which ones show meaningful directional relationship on their own.
Multivariate OLS
A combined regression then tests how those variables behave once they are placed into the same model together.
Project Highlights
Social Profile Dataset
Uses a profile and activity dataset with age, photos, tags, posts, replies, likes, education, events, and friend count.
Engagement Heatmap
Uses a heatmap to reveal the strongest platform patterns, especially the tight post-reply link and the photo-album-tag relationship cluster.
OLS Regression Comparison
Compares single-variable and multivariate OLS to show the difference between isolated and combined explanatory signal.
Life-Stage Reading
Uses age and children together to read the platform as a life-stage environment where younger and older users appear to maintain different social patterns.